ReGraph
Showcase
Storybook
Playground
Docs
API
Download
Support
All
API
Docs
Demos
Blogs
Webinars
Log in
Request a trial
ReGraph
Showcase
Storybook
Playground
Docs
API
Download
Support
Log in
Request a trial
The
React library for
advanced graph visualization
Have timeline data?
Explore KronoGraph
Showcase
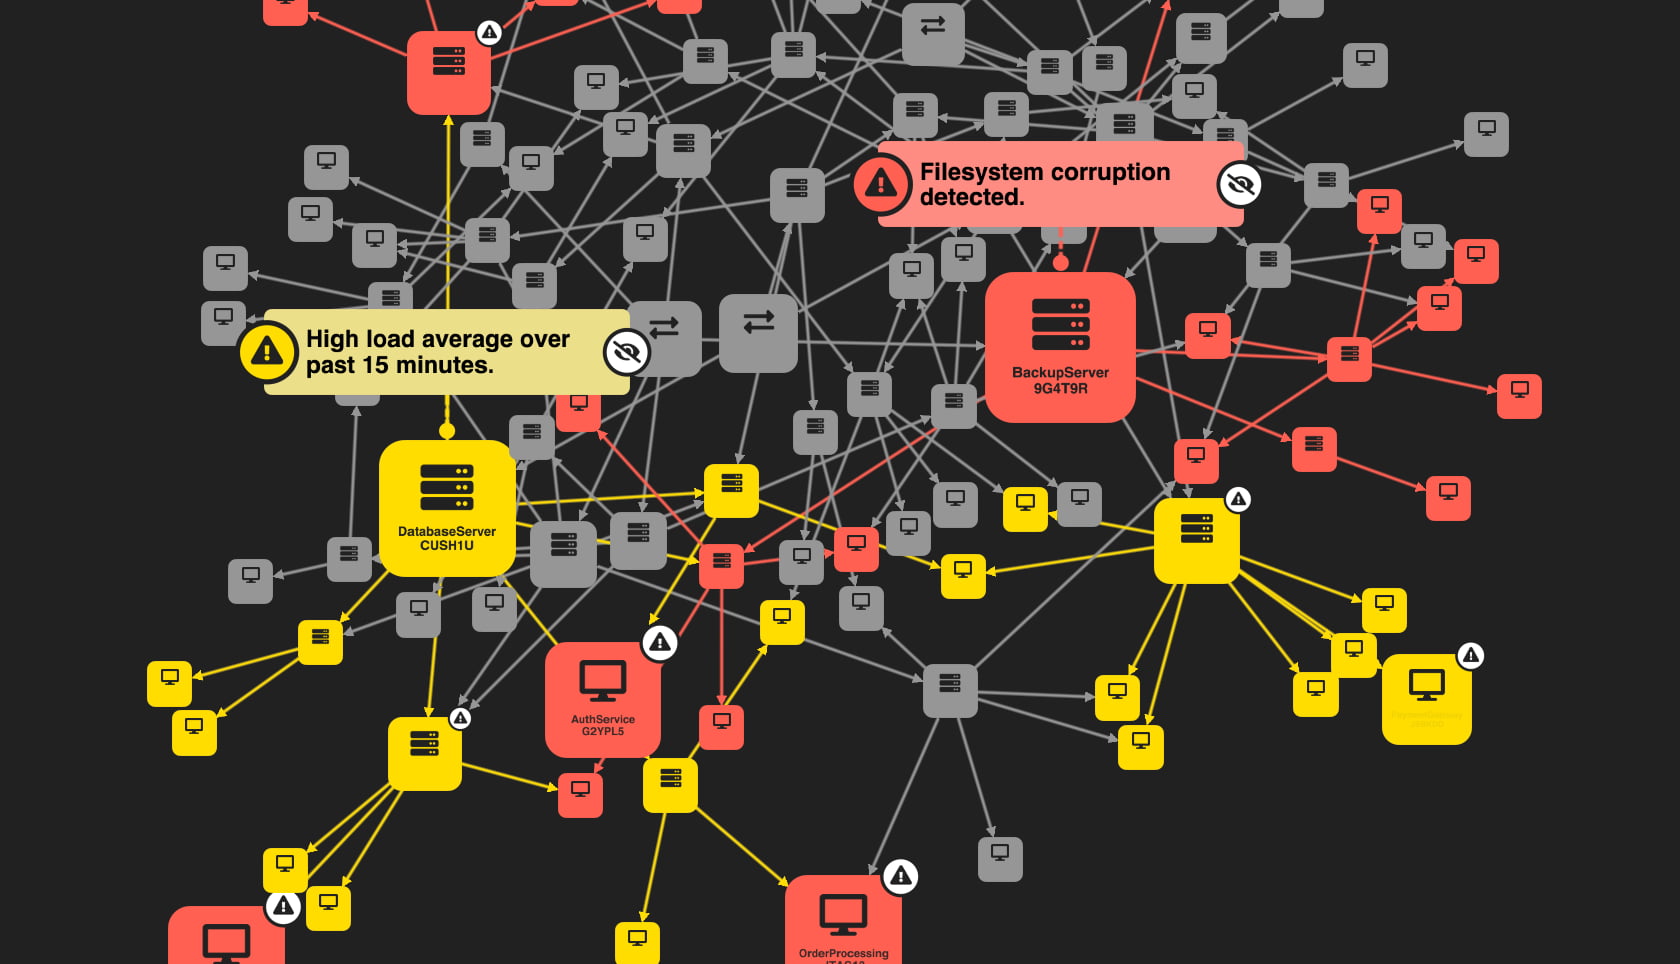
Discover impact among dependencies
Build a story through enriched node content using ReGraph's styling capabilities.
Analyze the impact of errors on a cyber network in this showcase.
Cyber Impact showcase
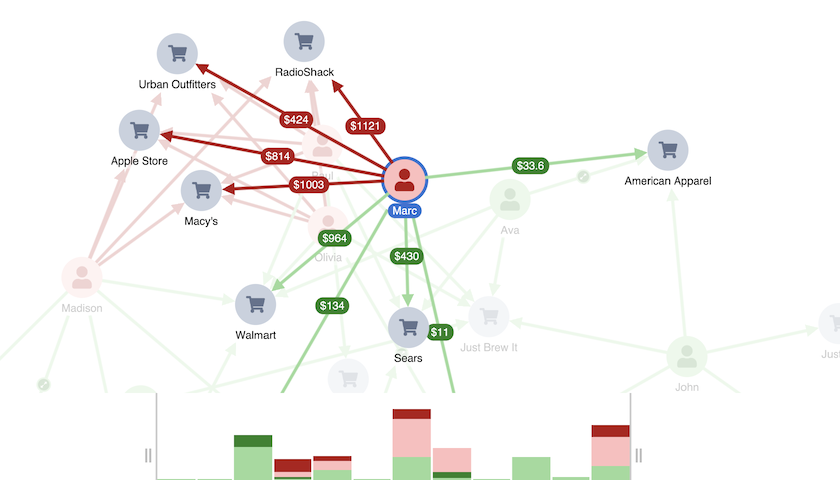
Investigate fraud trails over time
Use ReGraph's time bar to filter transactions over time and highlight suspicious activity.
Identify the origin of credit card fraud in this showcase.
Credit Card Fraud showcase
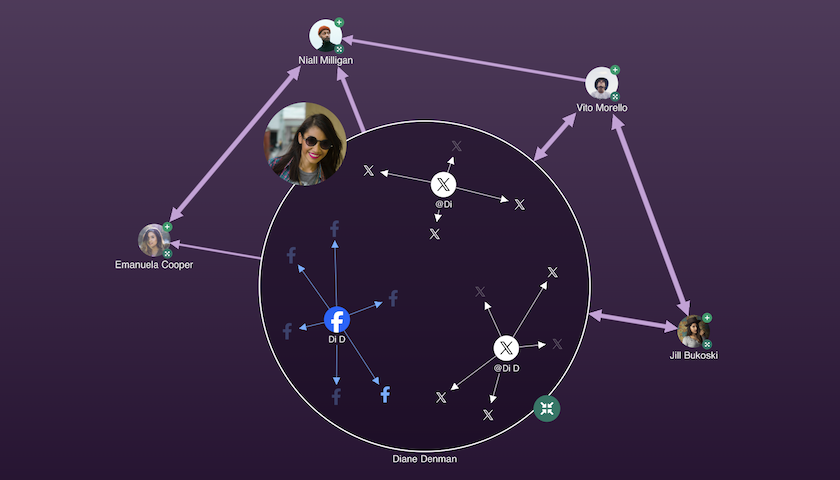
Explore patterns through grouped entities
Group multiple entities into combos to spot patterns without overwhelming the chart.
Drill down into social media posts to explore relationships between accounts in this showcase.
Social Media Analysis showcase
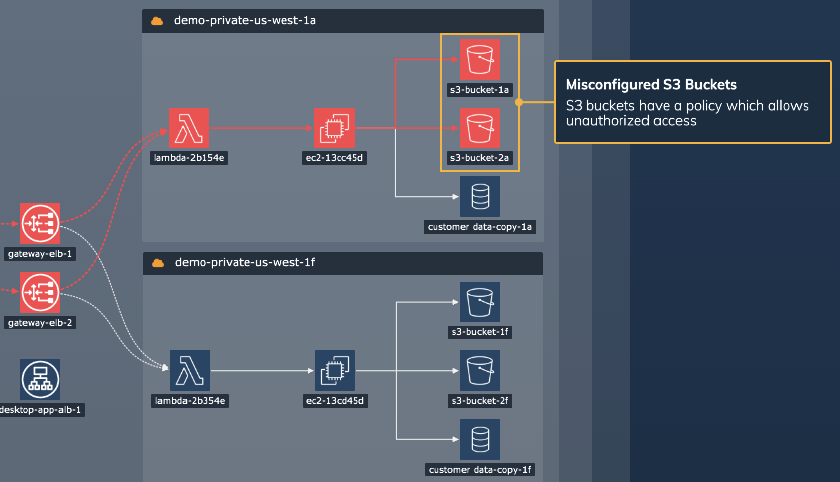
Organize complex infrastructures
Combos in ReGraph provide a hierarchical structure to help users understand complex data.
Explore attack paths and alerts on a cloud infrastructure in this showcase.
Cloud Security showcase
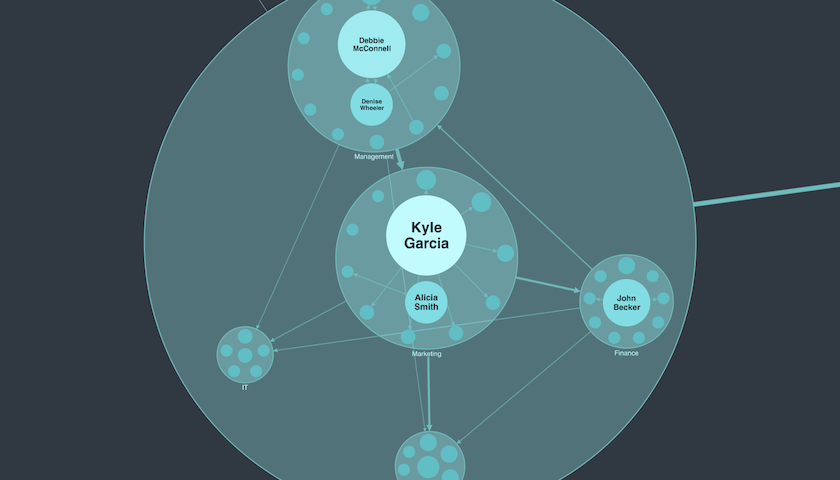
Analyze complex relationships
ReGraph includes advanced social network algorithms to analyze the connections in your data.
Explore employee relationships and hierarchies in this showcase.
Network Analysis showcase
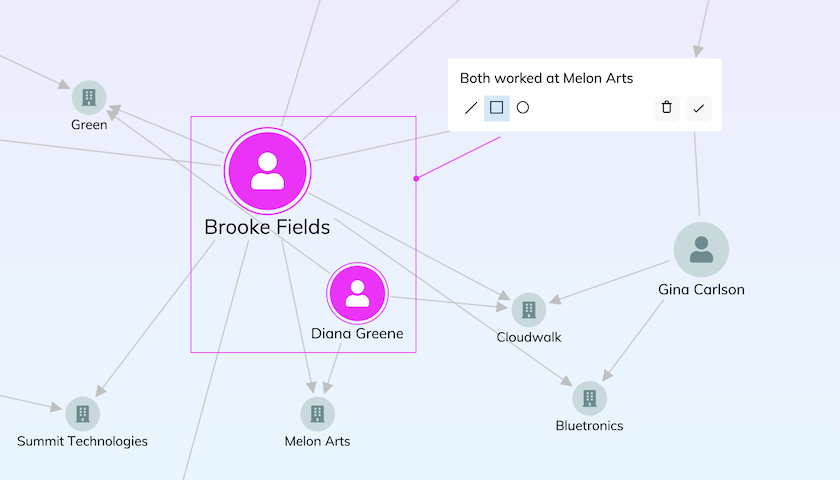
Bring analysis to life through narratives
Add annotations in your charts to record or share important information during your investigations.
Annotate employee relationships and connections in this showcase.
Annotations showcase
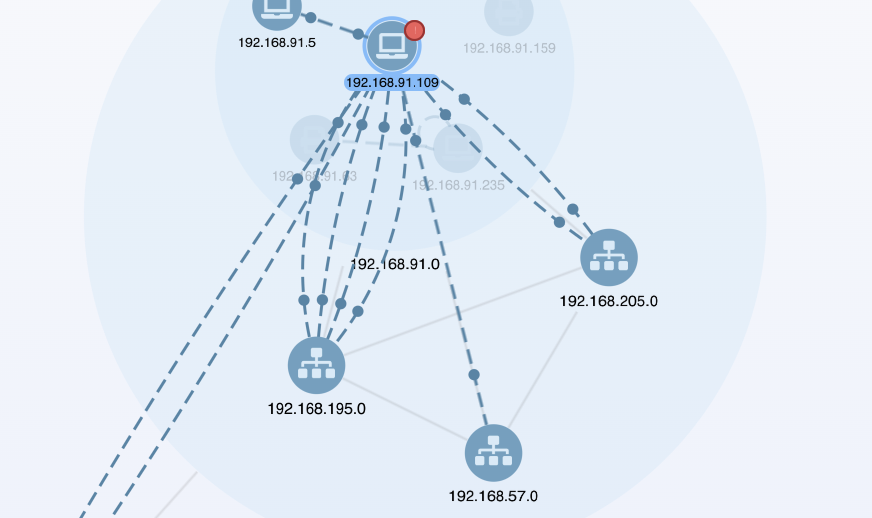
Drill down to pinpoint network issues
Organize multi-level networks with nested combos and quickly reveal issues at any network level.
Explore the alerts on a worldwide IT network in this showcase.
Network Alerts showcase
Simulate impact through filtering
Transition seamlessly through different views of the same data when filtering.
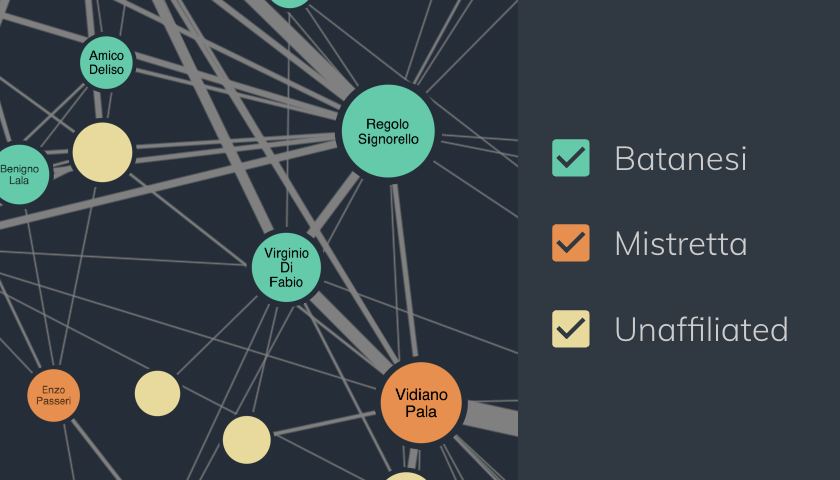
Disrupt influential mafia families in this showcase.
Mafia Networks showcase
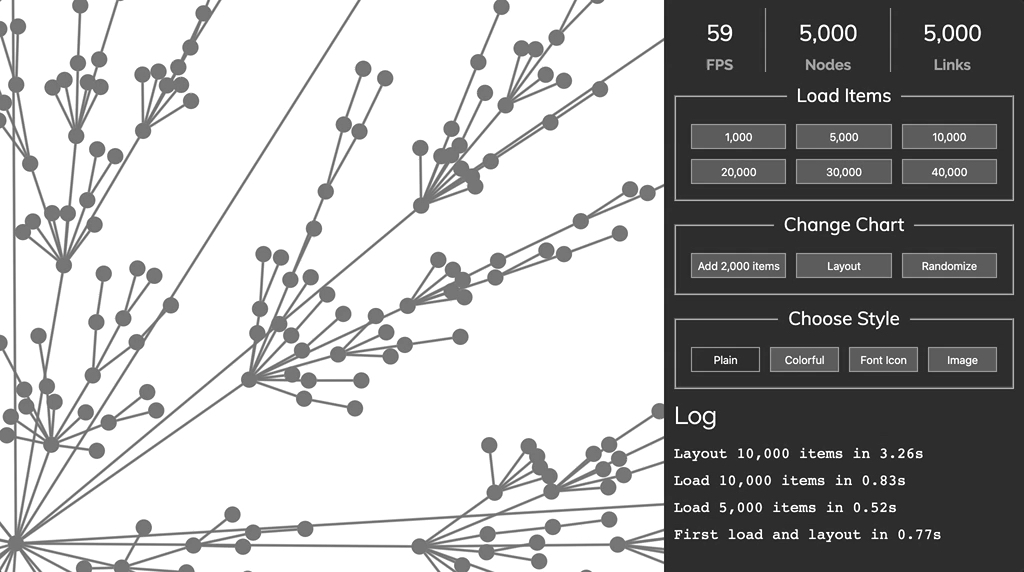
Render large graphs seamlessly
Powered by WebGL, ReGraph harnesses the GPU for smooth and fast rendering.
Benchmark ReGraph's rendering and layouts in this showcase.
Performance showcase
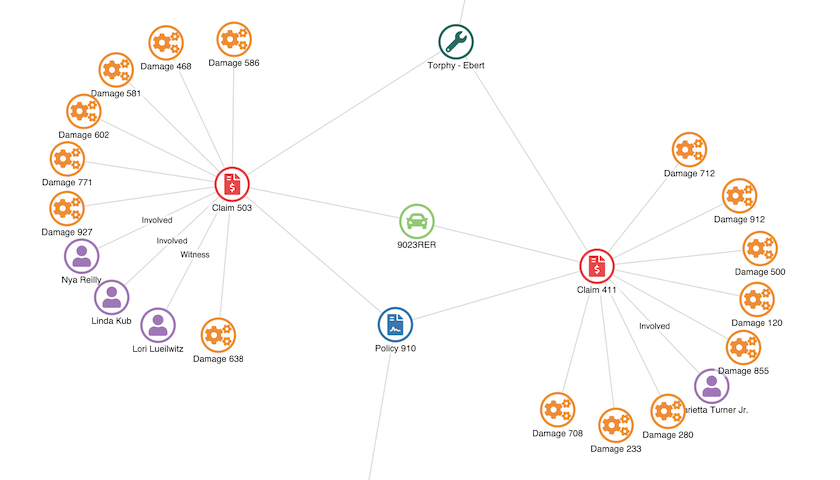
Maximize insights with the right view
ReGraph's features offer just the right view for your manipulated data to maximize the insights.
Examine insurance claims and investigate suspicious parties in this showcase.
Insurance Fraud showcase
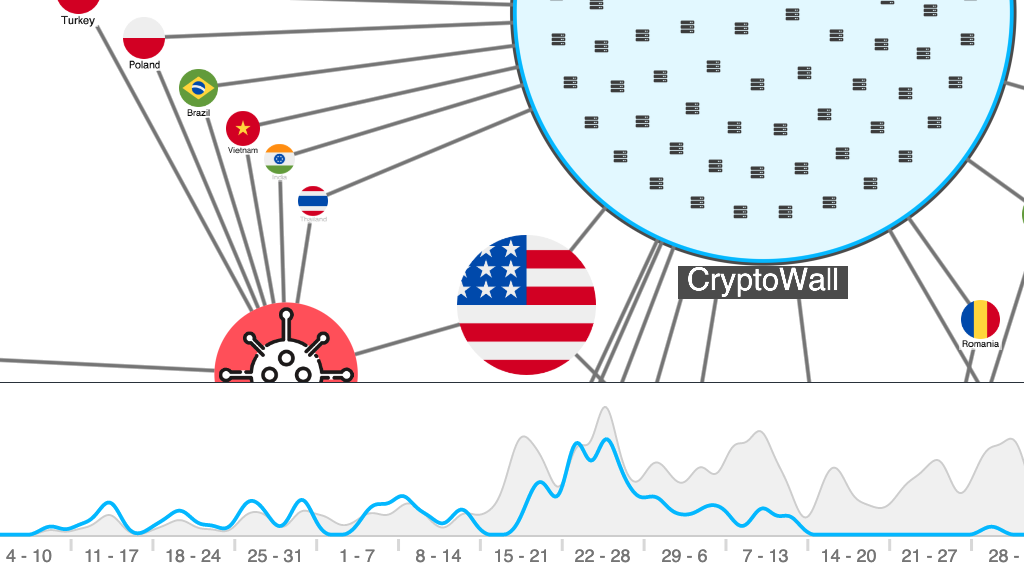
Reduce noise with time filtering
Use combos and time bar to analyze large datasets over time without cluttering the chart.
Explore ransomware attacks in this showcase.
Ransomware Attacks showcase